Financial headlines1
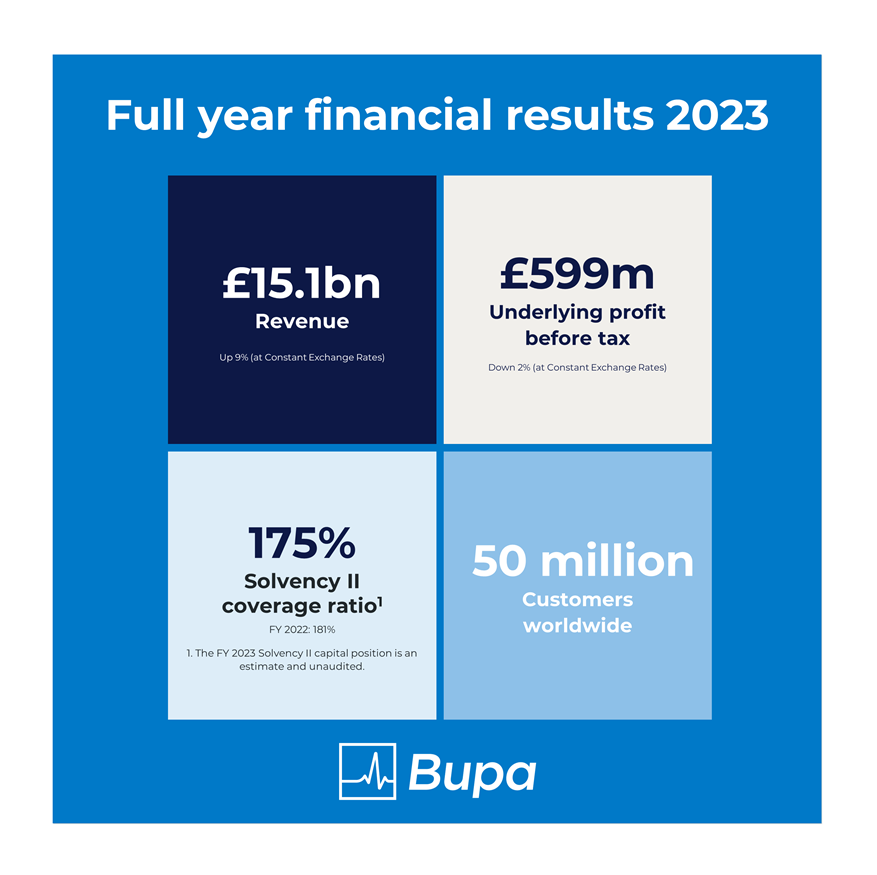
Revenue2,3 of £15.1bn was up 9% (2022: £13.9bn) at Constant Exchange Rates (CER)4 with period-on-period growth across all lines of business and Market Units driven by:
- Customer volume growth with health insurance customers increasing by over five million5 and provision customers by one million. Occupancy rates in aged care increasing by 4ppt to 92% exceeding pre-COVID levels (2019: 88%).
- The impact of pricing action, as we seek to balance elevated levels of inflation, remaining competitive for our customers and maintaining discipline in our underwriting of insurance risk.
Underlying profit6 before taxation of £599m was down 2% at CER (2022: £612m) as strong customer growth and higher investment returns were offset by lower profits in Australia Health Insurance, due to timing differences between the recognition of COVID-19 claims savings and returns made to customers as part of our COVID-19 support programme introduced during the pandemic. In 2023 the cost of returning claim savings (accumulated through the pandemic) to customers increased to £312m (2022: £240m)7.
The amount of COVID-19 claim savings realised diminished in 2023 relative to 2022 as claims frequency increased following the pandemic. In 2022 we also recognised £117m of tangible asset impairments in UK Dental, which was not repeated in 2023.
Statutory profit before taxation of £564m increased by £954m at AER (2022: £(390)m loss) driven by a significant reduction in non-underlying items following £888m of impairments in 2022.
Solvency II capital coverage ratio remains strong at 175%8 (2022: 181%) with leverage (excluding IFRS 16 lease liabilities) of 20.1% (2022: 18.7%).
Full Year 2023 results demonstrate that our strategy is delivering strong results with broad-based growth across all lines of business and Market Units against a backdrop of continued macro-economic, political and regulatory uncertainty.
Iñaki Ereño, Group CEO, commented: "Our results show that we are continuing to make good progress on delivering on our strategy with strong organic growth across our health insurance businesses, increased activity in our health provision businesses to meet growing customer demand and increased occupancy in our aged care homes and villages.”
Market Performance (all at CER)
Bupa Asia Pacific: Revenue increased by 5% to £5,726m. This was driven by customer growth in Australia Health Insurance, higher occupancy in aged care and increased activity in Hong Kong9 health services. On a reported basis, underlying profit reduced by 62% to £154m due to timing differences between the recognition of COVID-19 claims savings and returns to customers in Australia Health Insurance.
Europe and Latin America: Revenue grew by 12% to £5,083m as a result of customer growth across most of our businesses. Underlying profit increased by 17% to £355m in the year, driven by revenue growth, higher margins and increased investment returns with 2022 also being impacted by a £41m one-off Consumer Price Index (CPI) linked performance catch-up on a long-standing public private partnership (PPP) hospital contract in Spain. In Bupa Chile the October 2022 regulator-approved Garantías Explícitas en Salud (GES) pricing increases returned the Isapre to a small profit for the year. However, a court ruling has since cancelled the increase, effective from 1 January 2024.
Bupa Global and UK: Revenue grew by 10% to £4,235m driven by customer growth in insurance, increased occupancy in aged care and increased activity across health services. Underlying profit of £269m grew by £214m due to strong financial performance across all business units with 2022 also being impacted by £117m of UK Dental tangible asset impairments which were not repeated in 2023.
Other businesses: Our businesses in Saudi Arabia and India have delivered significant growth, with underlying profit increasing by 77% to £85m largely driven by higher volumes, margins and increased investment returns in Bupa Arabia.
Financial Position
- Solvency II capital coverage ratio remained strong at 175% (2022: 181%)
- Leverage ratio is 27.2% (2022: 26.5%) when including IFRS 16 lease liabilities. Excluding these liabilities, the leverage ratio is 20.1% (2022: 18.7%). In the first half of the year we repaid £250m of Tier 2 debt at maturity and we issued a €500m senior bond in October
- Net cash generated from operating activities increased by £216m period-on-period to £1,182m, driven by higher revenue, partly offset by the reduction in Australia Health Insurance profits
Other highlights
In 2023, we announced the acquisition of an additional stake in our Indian health insurance business, Niva Bupa, to make us the majority shareholder. This move comes as India's insurance industry is experiencing strong growth amidst increasing awareness and demand for health insurance. We completed the transaction in January 2024.
We expanded our provision footprint, opening 2 new hospitals, 36 clinics and 17 dental centres globally10.
We now have over 5.5m customers using Blua11, our digital health solution, with plans to significantly increase this going forward.
In 2023, 87% of our business units improved their Net Promoter Score (NPS).
We completed the rollout of ‘Viva, Healthier and Happier’, a new employee health and wellbeing programme that offers medical benefits to 100% of Bupa colleagues, representing an additional £26 million investment into our people.
We scored highly on our global People Pulse survey, achieving a global engagement result of 82 (80 in November 2022), exceeding the high performing (top decile) external benchmark by two points.
We invested £12.8m in our communities, with over £4.4m of this through the Bupa Foundations.
In 2023, 90% of our electricity consumption was from renewable sources, an increase of 36 percentage points compared with 2019, showing our commitment towards becoming a net zero business across all our emissions by 2040.
We became the official healthcare sponsor of the Mexican Paralympics Association, building on our existing partnerships in Great Britain, Spain, Poland, Australia and Chile.
Note on Chile
As disclosed previously, Bupa's Isapre business in Chile has been negatively impacted by judicial and regulatory action. The Chilean Supreme Court has significantly shifted its interpretation of Isapre pricing in recent years, with the cumulative effect of restricting the previously permitted, and generally accepted, pricing/rate-setting approach. The potential short and long-term implications for Bupa's Isapre business remain highly uncertain, however, some recent developments suggest that a revised pricing framework could emerge to support the sustainability of the industry.
In the meantime, we continue to recognise contingent liabilities regarding the potential retrospective financial implications relating to the Isapre business. Further details are included in the Financial Review.
Read the Bupa Group 2023 full year financial results statement.
1 Financial results are based on the new accounting standard for insurance contracts, IFRS 17 and the updated definition of underlying profit, with prior period comparators restated where applicable.
2 Revenues from associate businesses are excluded from reported figures. Customer numbers include 100% of our associate figures. Economic post-tax profits include the associate contribution in line with our shareholding.
3 Revenue calculated based on the aggregation of “insurance revenue” and “total non-insurance revenue” as shown in the Consolidated Income Statement.
4 Constant exchange rate (CER) financials are the retranslation of the prior year Actual Exchange Rates (AER) financials based on the current financial years average rate.
5 Includes customer numbers for associate businesses.
6 Underlying profit is a Non-GAAP financial measure. This means it is not comparable to other companies. Underlying profit reflects our trading performance and excludes a number of items included in statutory profit before taxation, to facilitate period-on-period comparison. A reconciliation to statutory profit before taxation can be found in the notes to the financial statements.
7 Note variance to Full Year 2022 disclosures relates to change in accounting for premium rate deferrals under IFRS 17. Previously expensed as incurred but now restated and recognised over the duration of the contract to which the deferral relates.
8 The FY 2023 Solvency II capital coverage ratio is an estimate and unaudited.
9 Refers to Hong Kong SAR (Special Administrative Region) across the statement.
10 Refers to provision acquisitions only, excludes the impact of disposals including our decision to close, sell or merge 85 of our 475 dental practices in the UK.
11 5.5 million customers are using Blua, our digital healthcare service, or an equivalent digital health solution.
Enquiries
Media: Duncan West (Corporate Affairs): [email protected]
Investors: Gareth Evans (Treasury): [email protected]
About Bupa
Bupa's purpose is helping people live longer, healthier, happier lives and making a better world. We are an international healthcare company serving over 50 million customers worldwide1. With no shareholders, we reinvest profits into providing more and better healthcare for the benefit of current and future customers.
Through 2023, we directly employed around 87,0002 people, principally in the UK, Australia, Spain, Chile, Poland, New Zealand, Hong Kong SAR, Türkiye, Brazil, Mexico, the US, Middle East and Ireland. We also have an associate business in Saudi Arabia. From 2024 onwards, our associate business in India, Niva Bupa, will become part of Bupa Global and UK following the acquisition of a majority shareholding in January 2024.
1 Customer counting methodologies may vary between business units.
2 Based on average number of employees during the year and including 16,000 colleagues in Poland who are engaged under contract for service arrangements.